prometheus-2.54.1.Linux-amd64.tar.gz
下载地址:
https://www.prometheus.io/download/
node_exporter-1.8.2.Linux-amd64.tar.gz
下载地址:
https://prometheus.io/download/#node_exporter
consul_exporter-0.12.1.linux-amd64.tar.gz
下载地址:
pushgateway-1.9.0.linux-amd64.tar.gz
下载地址:
https://www.prometheus.io/download/#pushgateway
victoria-metrics-linux-amd64-v1.103.0.tar.gz
下载地址:
https://github.com/VictoriaMetrics/VictoriaMetrics/releases
https://github.com/VictoriaMetrics/VictoriaMetrics/releases/tag/v1.103.0
consul_1.19.2_linux_amd64.zip
https://releases.hashicorp.com/consul/1.19.2/consul_1.19.2_linux_amd64.zip
grafana-7.5.6-1.x86_64.rpm
下载地址:https://dl.grafana.com/oss/release/grafana-7.5.6-1.x86_64.rpm
CentOS 7.9
注意:prometheus,victoria-metrics,grafana,pushgateway 都可以安装在不同机器上,本文仅涉及学习实践,所以,都安装在同一台机器上了。
# wget https://Github.com/VictoriaMetrics/VictoriaMetrics/releases/download/v1.103.0/victoria-metrics-linux-amd64-v1.103.0.tar.gz
# tar -xvzf victoria-metrics-linux-amd64-v1.103.0.tar.gz -C /usr/local/bin # 解压后会生成一个名为victoria-metrics-prod的二进制文件
# 创建一个用于存储VictoriaMetrics数据的文件夹
# mkdir -p /usr/data/victoria-metrics
# 创建服务
# vi /etc/systemd/system/victoriametrics.service
[Unit]
Description=Victoria metrics service
After=network.target

[Service]
Type=simple
Restart=always
TimeoutStartSec=30
Restart=on-failure
RestartSec=5s
ExecStart=/usr/local/bin/victoria-metrics-prod -storageDataPath=/usr/data/victoria-metrics -retentionPeriod=30d -selfScrapeInterval=10s
ExecStop=/bin/kill $MAINPID
ExecReload=/bin/kill -HUP $MAINPID

PrivateTmp=yes

[Install]
WantedBy=multi-user.target
说明:
-storageDataPath 设置数据目录路径(如果目录路径不存在,程序启动时会自动创建)。VictoriaMetrics会将所有数据存储在此目录中。默认存储在当前工作目录中的victoria-metrics-data目录
-retentionPeriod 设置存储数据的保留。自动删除旧的数据。默认保留时间为1个月(31天)。 最小值为24h或者1d,-retentionPeriod=3设置数据仅存储3个月,-retentionPeriod=1d设置数据仅保留1天。
一般情况下,只需要设置上述两个参数标识即可,其它参数已经有足够好的默认值,仅在确实需要修改它们时才进行设置,执行./victoria-metrics-prod --help 可以查看所有可获取的参数描述和及其默认值所有可获取的参数描述和默认值。
默认的,VictoriaMetrics通过端口8428监听Prometheus查询API请求
建议为 VictoriaMetrics设置监控
前台启动查看
# /usr/local/bin/victoria-metrics-prod -storageDataPath=/usr/data/victoria-metrics -retentionPeriod=30d -selfScrapeInterval=10s
2024-09-03T16:33:42.187Z	info	VictoriaMetrics/lib/logger/flag.Go:12	build version: victoria-metrics-20240828-135248-tags-v1.103.0-0-g5aeb759df9
2024-09-03T16:33:42.187Z	info	VictoriaMetrics/lib/logger/flag.go:13	command-line flags
2024-09-03T16:33:42.187Z	info	VictoriaMetrics/lib/logger/flag.go:20	  -retentionPeriod="30d"
2024-09-03T16:33:42.187Z	info	VictoriaMetrics/lib/logger/flag.go:20	  -selfScrapeInterval="10s"
2024-09-03T16:33:42.187Z	info	VictoriaMetrics/lib/logger/flag.go:20	  -storageDataPath="/usr/data/victoria-metrics"
2024-09-03T16:33:42.187Z	info	VictoriaMetrics/app/victoria-metrics/main.go:73	starting VictoriaMetrics at "[:8428]"...
2024-09-03T16:33:42.187Z	info	VictoriaMetrics/app/vmstorage/main.go:107	opening storage at "/usr/data/victoria-metrics" with -retentionPeriod=30d
2024-09-03T16:33:42.189Z	info	VictoriaMetrics/lib/memory/memory.go:42	limiting caches to 611758080 bytes, leaving 407838720 bytes to the OS according to -memory.allowedPercent=60
2024-09-03T16:33:42.205Z	info	VictoriaMetrics/app/vmstorage/main.go:121	successfully opened storage "/usr/data/victoria-metrics" in 0.018 seconds; partsCount: 0; blocksCount: 0; rowsCount: 0; sizeBytes: 0
2024-09-03T16:33:42.205Z	info	VictoriaMetrics/app/vmselect/promql/rollup_result_cache.go:127	loading rollupResult cache from "/usr/data/victoria-metrics/cache/rollupResult"...
2024-09-03T16:33:42.207Z	info	VictoriaMetrics/app/vmselect/promql/rollup_result_cache.go:156	loaded rollupResult cache from "/usr/data/victoria-metrics/cache/rollupResult" in 0.001 seconds; entriesCount: 0, sizeBytes: 0
2024-09-03T16:33:42.207Z	info	VictoriaMetrics/app/victoria-metrics/main.go:84	started VictoriaMetrics in 0.020 seconds
2024-09-03T16:33:42.207Z	info	VictoriaMetrics/lib/httpserver/httpserver.go:121	starting server at http://127.0.0.1:8428/
2024-09-03T16:33:42.207Z	info	VictoriaMetrics/lib/httpserver/httpserver.go:122	pprof handlers are exposed at http://127.0.0.1:8428/debug/pprof/
2024-09-03T16:33:42.208Z	info	VictoriaMetrics/app/victoria-metrics/self_scraper.go:46	started self-scraping `/metrics` page with interval 10.000 seconds
2024-09-03T16:33:52.293Z	info	VictoriaMetrics/lib/storage/partition.go:202	creating a partition "2024_09" with smallPartsPath="/usr/data/victoria-metrics/data/small/2024_09", bigPartsPath="/usr/data/victoria-metrics/data/big/2024_09"
2024-09-03T16:33:52.295Z	info	VictoriaMetrics/lib/storage/partition.go:211	partition "2024_09" has been created
关闭前台启动的进程,启动服务并设置开机启动
# systemctl daemon-reload && sudo systemctl enable --now victoriametrics.service
# 查看服务是否启动成功
# systemctl status victoriametrics.service
# firewall-cmd --permanent --zone=public --add-port=8248/tcp
success
# firewall-cmd --reload
success
除了以二进制方式启动,VictoriaMetrics也支持Docker安装,具体可参考链接 https://hub.docker.com/r/victoriametrics/victoria-metrics/
https://docs.victoriametrics.com/quick-start/
# wget https://github.com/prometheus/prometheus/releases/download/v2.54.1/prometheus-2.54.1.linux-amd64.tar.gz
# tar -C /usr/local/ -xvzf prometheus-2.54.1.linux-amd64.tar.gz
# cd /usr/local/prometheus-2.54.1.linux-amd64
# ls
console_libraries  consoles  LICENSE  NOTICE  prometheus  prometheus.yml  promtool
# ln -s /usr/local/prometheus-2.26.0.linux-amd64/prometheus /usr/local/bin/prometheus
# cp prometheus.yml prometheus.yml.bak
# echo ''> prometheus.yml
# vi prometheus.yml
将prometheus.yml内容替换为以下内容
global:
  scrape_interval:     15s # 默认,每15秒采样一次目标

# 一份采样配置仅包含一个 endpoint 来做采样
# 下面是 Prometheus 本身的endpoint:
scrape_configs:
  # job_name 将被被当作一个标签 `job=<job_name>`添加到该配置的任意时序采样.
  - job_name: 'prometheus'

    # 覆盖全局默认值,从该job每5秒对目标采样一次
    scrape_interval: 5s

    static_configs:
      - targets: ['localhost:9090']

remote_write:
  - url: http://192.168.88.132:8428/api/v1/write
    queue_config:
      max_samples_per_send: 10000
      capacity: 20000
      max_shards: 30
说明:
为了能给VictoriaMetrics发送数据,在Prometheus配置文件中,增加remote_write 配置。 添加以下代码到 Prometheus 配置文件(一般是在prometheus.yml):
remote_write:
  - url: http://<victoriametrics-addr>:8428/api/v1/write
注意:添加时,需要替换<victoriametrics-addr>为VictoriaMetrics主机名称或者IP地址,形如以下
remote_write:
  - url: http://192.168.88.132.71.170:8428/api/v1/write
启动Prometheus服务
# ./prometheus
ts=2024-09-04T15:50:32.906Z caller=main.go:601 level=info msg="No time or size retention was set so using the default time retention" duration=15d
ts=2024-09-04T15:50:32.906Z caller=main.go:645 level=info msg="Starting Prometheus Server" mode=server version="(version=2.54.1, branch=HEAD, revision=e6cfa720fbe6280153fab13090a483dbd40bece3)"
ts=2024-09-04T15:50:32.906Z caller=main.go:650 level=info build_context="(go=go1.22.6, platform=linux/amd64, user=root@812ffd741951, date=20240827-10:56:41, tags=netgo,builtinassets,stringlabels)"
ts=2024-09-04T15:50:32.906Z caller=main.go:651 level=info host_details="(Linux 3.10.0-1160.el7.x86_64 #1 SMP Mon Oct 19 16:18:59 UTC 2020 x86_64 localhost.localdomain (none))"
ts=2024-09-04T15:50:32.906Z caller=main.go:652 level=info fd_limits="(soft=4096, hard=4096)"
ts=2024-09-04T15:50:32.906Z caller=main.go:653 level=info vm_limits="(soft=unlimited, hard=unlimited)"
ts=2024-09-04T15:50:32.917Z caller=web.go:571 level=info component=web msg="Start listening for connections" address=0.0.0.0:9090
ts=2024-09-04T15:50:32.925Z caller=main.go:1160 level=info msg="Starting TSDB ..."
ts=2024-09-04T15:50:32.930Z caller=tls_config.go:313 level=info component=web msg="Listening on" address=[::]:9090
ts=2024-09-04T15:50:32.930Z caller=tls_config.go:316 level=info component=web msg="TLS is disabled." http2=false address=[::]:9090
ts=2024-09-04T15:50:32.932Z caller=head.go:626 level=info component=tsdb msg="Replaying on-disk memory mappable chunks if any"
ts=2024-09-04T15:50:32.932Z caller=head.go:713 level=info component=tsdb msg="On-disk memory mappable chunks replay completed" duration=5.601µs
ts=2024-09-04T15:50:32.933Z caller=head.go:721 level=info component=tsdb msg="Replaying WAL, this may take a while"
ts=2024-09-04T15:50:32.933Z caller=head.go:793 level=info component=tsdb msg="WAL segment loaded" segment=0 maxSegment=0
ts=2024-09-04T15:50:32.933Z caller=head.go:830 level=info component=tsdb msg="WAL replay completed" checkpoint_replay_duration=25.237µs wal_replay_duration=560.14µs wbl_replay_duration=141ns chunk_snapshot_load_duration=0s mmap_chunk_replay_duration=5.601µs total_replay_duration=605.091µs
ts=2024-09-04T15:50:32.938Z caller=main.go:1181 level=info fs_type=XFS_SUPER_MAGIC
ts=2024-09-04T15:50:32.938Z caller=main.go:1184 level=info msg="TSDB started"
ts=2024-09-04T15:50:32.938Z caller=main.go:1367 level=info msg="Loading configuration file" filename=prometheus.yml
ts=2024-09-04T15:50:32.940Z caller=dedupe.go:112 component=remote level=info remote_name=b93975 url=http://192.168.88.132:8428/api/v1/write msg="Starting WAL watcher" queue=b93975
ts=2024-09-04T15:50:32.940Z caller=dedupe.go:112 component=remote level=info remote_name=b93975 url=http://192.168.88.132:8428/api/v1/write msg="Starting scraped metadata watcher"
ts=2024-09-04T15:50:32.945Z caller=main.go:1404 level=info msg="updated GOGC" old=100 new=75
ts=2024-09-04T15:50:32.945Z caller=main.go:1415 level=info msg="Completed loading of configuration file" filename=prometheus.yml totalDuration=6.619214ms db_storage=25.792µs remote_storage=1.190631ms web_handler=652ns query_engine=18.267µs scrape=3.897727ms scrape_sd=49.586µs notify=1.164µs notify_sd=954ns rules=60.122µs tracing=62.555µs
ts=2024-09-04T15:50:32.945Z caller=main.go:1145 level=info msg="Server is ready to receive web requests."
ts=2024-09-04T15:50:32.945Z caller=manager.go:164 level=info component="rule manager" msg="Starting rule manager..."
ts=2024-09-04T15:50:32.945Z caller=dedupe.go:112 component=remote level=info remote_name=b93975 url=http://192.168.88.132:8428/api/v1/write msg="Replaying WAL" queue=b93975
ts=2024-09-04T15:50:40.288Z caller=dedupe.go:112 component=remote level=info remote_name=b93975 url=http://192.168.88.132:8428/api/v1/write msg="Done replaying WAL" duration=7.342804783s
说明:如果希望使用非默认配置文件,可以在执行命令时指定具体的配置文件,类似如下:
# 创建服务
# vi /etc/systemd/system/victoriametrics.service
[Unit]
Description=Victoria metrics service
After=network.target

[Service]
Type=simple
Restart=always
TimeoutStartSec=30
Restart=on-failure
RestartSec=5s
ExecStart=/usr/local/bin/victoria-metrics-prod -storageDataPath=/usr/data/victoria-metrics -retentionPeriod=30d -selfScrapeInterval=10s
ExecStop=/bin/kill $MAINPID
ExecReload=/bin/kill -HUP $MAINPID

PrivateTmp=yes

[Install]
WantedBy=multi-user.target
0
备注:重启命令
# 创建服务
# vi /etc/systemd/system/victoriametrics.service
[Unit]
Description=Victoria metrics service
After=network.target

[Service]
Type=simple
Restart=always
TimeoutStartSec=30
Restart=on-failure
RestartSec=5s
ExecStart=/usr/local/bin/victoria-metrics-prod -storageDataPath=/usr/data/victoria-metrics -retentionPeriod=30d -selfScrapeInterval=10s
ExecStop=/bin/kill $MAINPID
ExecReload=/bin/kill -HUP $MAINPID

PrivateTmp=yes

[Install]
WantedBy=multi-user.target
1
当然也可直接Ctrl + c终止Prometheus进程,然后重新运行。
Prometheus把传入的数据写入到本地存储的同时将数据复制到远程存储。这意味着即使远程存储不可用,存储在本地,--storage.tsdb.retention.time 指定数据保留期内的数据依然可用。
如果需要从多个 Prometheus 实例往 VictoriaMetrics 发送数据,添加external_labels配置到Prometheus配置文件的global结点,形如以下:
# 创建服务
# vi /etc/systemd/system/victoriametrics.service
[Unit]
Description=Victoria metrics service
After=network.target

[Service]
Type=simple
Restart=always
TimeoutStartSec=30
Restart=on-failure
RestartSec=5s
ExecStart=/usr/local/bin/victoria-metrics-prod -storageDataPath=/usr/data/victoria-metrics -retentionPeriod=30d -selfScrapeInterval=10s
ExecStop=/bin/kill $MAINPID
ExecReload=/bin/kill -HUP $MAINPID

PrivateTmp=yes

[Install]
WantedBy=multi-user.target
2
如上,以上配置告诉 Prometheus 添加 datacenter=dc-123 标签到发送给远程存储的每个时间序列。标签名称可以是任意的,比如 datacenter 。标签值必须在所有 Prometheus 实例中保持唯一,这样,可以通过该标签过滤或者分组时序。
对于高负载的Prometheus实例(每秒200k+个样本),可以应用以下调优:
# 创建服务
# vi /etc/systemd/system/victoriametrics.service
[Unit]
Description=Victoria metrics service
After=network.target

[Service]
Type=simple
Restart=always
TimeoutStartSec=30
Restart=on-failure
RestartSec=5s
ExecStart=/usr/local/bin/victoria-metrics-prod -storageDataPath=/usr/data/victoria-metrics -retentionPeriod=30d -selfScrapeInterval=10s
ExecStop=/bin/kill $MAINPID
ExecReload=/bin/kill -HUP $MAINPID

PrivateTmp=yes

[Install]
WantedBy=multi-user.target
3
使用远程写入增加 Prometheus 约25%的内存使用率,这取决于数据形态(原文:Using remote write increases memory usage for Prometheus up to ~25% and depends on the shape of data)。如果你正面临太高内存消耗的问题,尝试降低 max_samples_per_send 和 capacity 参数配置值(注意:这两个参数是紧密相连的)查看更多关于远程写入调优.
建议升级Prometheus到 v2.12.0 或更高,因为之前版本使用 remote_write存在问题。
也可以查看下 vmagent 和 vmalert, 也是用于减少Prometheus更快和更少的资源消耗的一种选择方案。
参考链接:https://docs.victoriametrics.com/#prometheus-setup
# 创建服务
# vi /etc/systemd/system/victoriametrics.service
[Unit]
Description=Victoria metrics service
After=network.target

[Service]
Type=simple
Restart=always
TimeoutStartSec=30
Restart=on-failure
RestartSec=5s
ExecStart=/usr/local/bin/victoria-metrics-prod -storageDataPath=/usr/data/victoria-metrics -retentionPeriod=30d -selfScrapeInterval=10s
ExecStop=/bin/kill $MAINPID
ExecReload=/bin/kill -HUP $MAINPID

PrivateTmp=yes

[Install]
WantedBy=multi-user.target
4
# 创建服务
# vi /etc/systemd/system/victoriametrics.service
[Unit]
Description=Victoria metrics service
After=network.target
[Service]
Type=simple
Restart=always
TimeoutStartSec=30
Restart=on-failure
RestartSec=5s
ExecStart=/usr/local/bin/victoria-metrics-prod -storageDataPath=/usr/data/victoria-metrics -retentionPeriod=30d -selfScrapeInterval=10s
ExecStop=/bin/kill $MAINPID
ExecReload=/bin/kill -HUP $MAINPID
PrivateTmp=yes
[Install]
WantedBy=multi-user.target
5注意:配置文件必须使用绝对路径,否则运行服务报错,找不到文件/prometheus.yml
# 创建服务
# vi /etc/systemd/system/victoriametrics.service
[Unit]
Description=Victoria metrics service
After=network.target

[Service]
Type=simple
Restart=always
TimeoutStartSec=30
Restart=on-failure
RestartSec=5s
ExecStart=/usr/local/bin/victoria-metrics-prod -storageDataPath=/usr/data/victoria-metrics -retentionPeriod=30d -selfScrapeInterval=10s
ExecStop=/bin/kill $MAINPID
ExecReload=/bin/kill -HUP $MAINPID

PrivateTmp=yes

[Install]
WantedBy=multi-user.target
6# 创建服务
# vi /etc/systemd/system/victoriametrics.service
[Unit]
Description=Victoria metrics service
After=network.target
[Service]
Type=simple
Restart=always
TimeoutStartSec=30
Restart=on-failure
RestartSec=5s
ExecStart=/usr/local/bin/victoria-metrics-prod -storageDataPath=/usr/data/victoria-metrics -retentionPeriod=30d -selfScrapeInterval=10s
ExecStop=/bin/kill $MAINPID
ExecReload=/bin/kill -HUP $MAINPID
PrivateTmp=yes
[Install]
WantedBy=multi-user.target
7说明:如果使用yum命令安装找不到软件包,可以考虑下载安装,如下
# 创建服务
# vi /etc/systemd/system/victoriametrics.service
[Unit]
Description=Victoria metrics service
After=network.target

[Service]
Type=simple
Restart=always
TimeoutStartSec=30
Restart=on-failure
RestartSec=5s
ExecStart=/usr/local/bin/victoria-metrics-prod -storageDataPath=/usr/data/victoria-metrics -retentionPeriod=30d -selfScrapeInterval=10s
ExecStop=/bin/kill $MAINPID
ExecReload=/bin/kill -HUP $MAINPID

PrivateTmp=yes

[Install]
WantedBy=multi-user.target
8说明:如果不执行yum install -y fontconfig urw-fonts命令,安装grafana时可能报错,如下
# 创建服务
# vi /etc/systemd/system/victoriametrics.service
[Unit]
Description=Victoria metrics service
After=network.target

[Service]
Type=simple
Restart=always
TimeoutStartSec=30
Restart=on-failure
RestartSec=5s
ExecStart=/usr/local/bin/victoria-metrics-prod -storageDataPath=/usr/data/victoria-metrics -retentionPeriod=30d -selfScrapeInterval=10s
ExecStop=/bin/kill $MAINPID
ExecReload=/bin/kill -HUP $MAINPID

PrivateTmp=yes

[Install]
WantedBy=multi-user.target
9# /usr/local/bin/victoria-metrics-prod -storageDataPath=/usr/data/victoria-metrics -retentionPeriod=30d -selfScrapeInterval=10s
2024-09-03T16:33:42.187Z info VictoriaMetrics/lib/logger/flag.Go:12 build version: victoria-metrics-20240828-135248-tags-v1.103.0-0-g5aeb759df9
2024-09-03T16:33:42.187Z info VictoriaMetrics/lib/logger/flag.go:13 command-line flags
2024-09-03T16:33:42.187Z info VictoriaMetrics/lib/logger/flag.go:20 -retentionPeriod="30d"
2024-09-03T16:33:42.187Z info VictoriaMetrics/lib/logger/flag.go:20 -selfScrapeInterval="10s"
2024-09-03T16:33:42.187Z info VictoriaMetrics/lib/logger/flag.go:20 -storageDataPath="/usr/data/victoria-metrics"
2024-09-03T16:33:42.187Z info VictoriaMetrics/app/victoria-metrics/main.go:73 starting VictoriaMetrics at "[:8428]"...
2024-09-03T16:33:42.187Z info VictoriaMetrics/app/vmstorage/main.go:107 opening storage at "/usr/data/victoria-metrics" with -retentionPeriod=30d
2024-09-03T16:33:42.189Z info VictoriaMetrics/lib/memory/memory.go:42 limiting caches to 611758080 bytes, leaving 407838720 bytes to the OS according to -memory.allowedPercent=60
2024-09-03T16:33:42.205Z info VictoriaMetrics/app/vmstorage/main.go:121 successfully opened storage "/usr/data/victoria-metrics" in 0.018 seconds; partsCount: 0; blocksCount: 0; rowsCount: 0; sizeBytes: 0
2024-09-03T16:33:42.205Z info VictoriaMetrics/app/vmselect/promql/rollup_result_cache.go:127 loading rollupResult cache from "/usr/data/victoria-metrics/cache/rollupResult"...
2024-09-03T16:33:42.207Z info VictoriaMetrics/app/vmselect/promql/rollup_result_cache.go:156 loaded rollupResult cache from "/usr/data/victoria-metrics/cache/rollupResult" in 0.001 seconds; entriesCount: 0, sizeBytes: 0
2024-09-03T16:33:42.207Z info VictoriaMetrics/app/victoria-metrics/main.go:84 started VictoriaMetrics in 0.020 seconds
2024-09-03T16:33:42.207Z info VictoriaMetrics/lib/httpserver/httpserver.go:121 starting server at http://127.0.0.1:8428/
2024-09-03T16:33:42.207Z info VictoriaMetrics/lib/httpserver/httpserver.go:122 pprof handlers are exposed at http://127.0.0.1:8428/debug/pprof/
2024-09-03T16:33:42.208Z info VictoriaMetrics/app/victoria-metrics/self_scraper.go:46 started self-scraping `/metrics` page with interval 10.000 seconds
2024-09-03T16:33:52.293Z info VictoriaMetrics/lib/storage/partition.go:202 creating a partition "2024_09" with smallPartsPath="/usr/data/victoria-metrics/data/small/2024_09", bigPartsPath="/usr/data/victoria-metrics/data/big/2024_09"
2024-09-03T16:33:52.295Z info VictoriaMetrics/lib/storage/partition.go:211 partition "2024_09" has been created
0浏览器输入网址:http://<grafana-addr>:3000访问看看效果:
备注:grafana默认登录账号密码为admin/admin
参考链接:https://grafana.com/grafana/download?pg=get&plcmt=selfmanaged-box1-cta1
# /usr/local/bin/victoria-metrics-prod -storageDataPath=/usr/data/victoria-metrics -retentionPeriod=30d -selfScrapeInterval=10s
2024-09-03T16:33:42.187Z	info	VictoriaMetrics/lib/logger/flag.Go:12	build version: victoria-metrics-20240828-135248-tags-v1.103.0-0-g5aeb759df9
2024-09-03T16:33:42.187Z	info	VictoriaMetrics/lib/logger/flag.go:13	command-line flags
2024-09-03T16:33:42.187Z	info	VictoriaMetrics/lib/logger/flag.go:20	  -retentionPeriod="30d"
2024-09-03T16:33:42.187Z	info	VictoriaMetrics/lib/logger/flag.go:20	  -selfScrapeInterval="10s"
2024-09-03T16:33:42.187Z	info	VictoriaMetrics/lib/logger/flag.go:20	  -storageDataPath="/usr/data/victoria-metrics"
2024-09-03T16:33:42.187Z	info	VictoriaMetrics/app/victoria-metrics/main.go:73	starting VictoriaMetrics at "[:8428]"...
2024-09-03T16:33:42.187Z	info	VictoriaMetrics/app/vmstorage/main.go:107	opening storage at "/usr/data/victoria-metrics" with -retentionPeriod=30d
2024-09-03T16:33:42.189Z	info	VictoriaMetrics/lib/memory/memory.go:42	limiting caches to 611758080 bytes, leaving 407838720 bytes to the OS according to -memory.allowedPercent=60
2024-09-03T16:33:42.205Z	info	VictoriaMetrics/app/vmstorage/main.go:121	successfully opened storage "/usr/data/victoria-metrics" in 0.018 seconds; partsCount: 0; blocksCount: 0; rowsCount: 0; sizeBytes: 0
2024-09-03T16:33:42.205Z	info	VictoriaMetrics/app/vmselect/promql/rollup_result_cache.go:127	loading rollupResult cache from "/usr/data/victoria-metrics/cache/rollupResult"...
2024-09-03T16:33:42.207Z	info	VictoriaMetrics/app/vmselect/promql/rollup_result_cache.go:156	loaded rollupResult cache from "/usr/data/victoria-metrics/cache/rollupResult" in 0.001 seconds; entriesCount: 0, sizeBytes: 0
2024-09-03T16:33:42.207Z	info	VictoriaMetrics/app/victoria-metrics/main.go:84	started VictoriaMetrics in 0.020 seconds
2024-09-03T16:33:42.207Z	info	VictoriaMetrics/lib/httpserver/httpserver.go:121	starting server at http://127.0.0.1:8428/
2024-09-03T16:33:42.207Z	info	VictoriaMetrics/lib/httpserver/httpserver.go:122	pprof handlers are exposed at http://127.0.0.1:8428/debug/pprof/
2024-09-03T16:33:42.208Z	info	VictoriaMetrics/app/victoria-metrics/self_scraper.go:46	started self-scraping `/metrics` page with interval 10.000 seconds
2024-09-03T16:33:52.293Z	info	VictoriaMetrics/lib/storage/partition.go:202	creating a partition "2024_09" with smallPartsPath="/usr/data/victoria-metrics/data/small/2024_09", bigPartsPath="/usr/data/victoria-metrics/data/big/2024_09"
2024-09-03T16:33:52.295Z	info	VictoriaMetrics/lib/storage/partition.go:211	partition "2024_09" has been created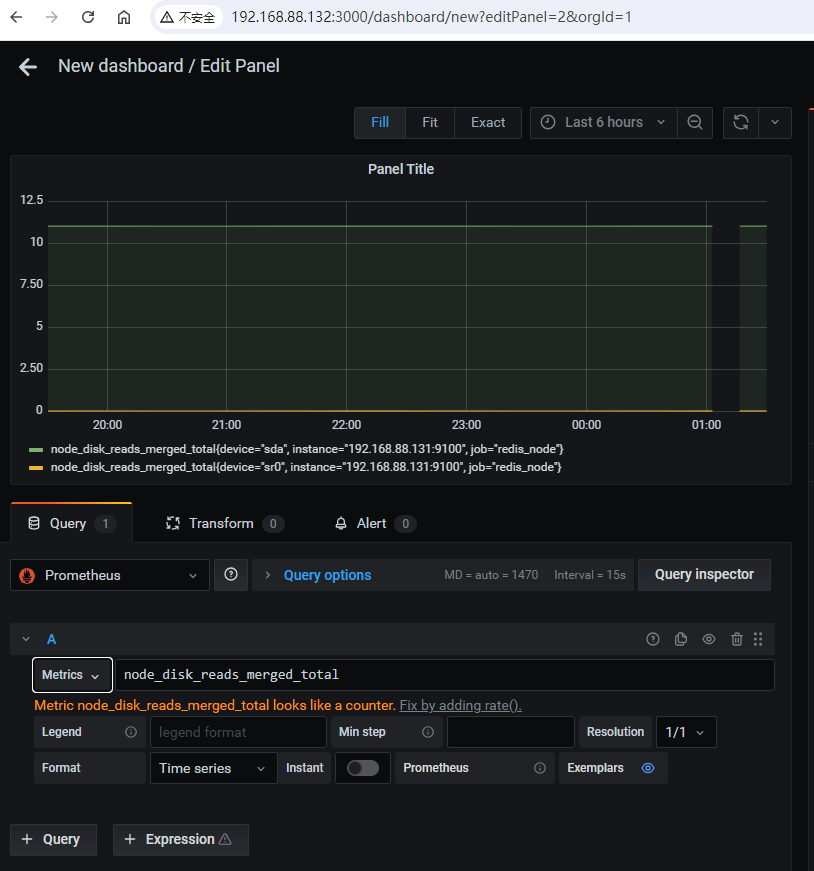
1使用以下URL创建 Prometheus数据源 (创建数据源时仅修改URL,其它保持默认) :
# /usr/local/bin/victoria-metrics-prod -storageDataPath=/usr/data/victoria-metrics -retentionPeriod=30d -selfScrapeInterval=10s
2024-09-03T16:33:42.187Z	info	VictoriaMetrics/lib/logger/flag.Go:12	build version: victoria-metrics-20240828-135248-tags-v1.103.0-0-g5aeb759df9
2024-09-03T16:33:42.187Z	info	VictoriaMetrics/lib/logger/flag.go:13	command-line flags
2024-09-03T16:33:42.187Z	info	VictoriaMetrics/lib/logger/flag.go:20	  -retentionPeriod="30d"
2024-09-03T16:33:42.187Z	info	VictoriaMetrics/lib/logger/flag.go:20	  -selfScrapeInterval="10s"
2024-09-03T16:33:42.187Z	info	VictoriaMetrics/lib/logger/flag.go:20	  -storageDataPath="/usr/data/victoria-metrics"
2024-09-03T16:33:42.187Z	info	VictoriaMetrics/app/victoria-metrics/main.go:73	starting VictoriaMetrics at "[:8428]"...
2024-09-03T16:33:42.187Z	info	VictoriaMetrics/app/vmstorage/main.go:107	opening storage at "/usr/data/victoria-metrics" with -retentionPeriod=30d
2024-09-03T16:33:42.189Z	info	VictoriaMetrics/lib/memory/memory.go:42	limiting caches to 611758080 bytes, leaving 407838720 bytes to the OS according to -memory.allowedPercent=60
2024-09-03T16:33:42.205Z	info	VictoriaMetrics/app/vmstorage/main.go:121	successfully opened storage "/usr/data/victoria-metrics" in 0.018 seconds; partsCount: 0; blocksCount: 0; rowsCount: 0; sizeBytes: 0
2024-09-03T16:33:42.205Z	info	VictoriaMetrics/app/vmselect/promql/rollup_result_cache.go:127	loading rollupResult cache from "/usr/data/victoria-metrics/cache/rollupResult"...
2024-09-03T16:33:42.207Z	info	VictoriaMetrics/app/vmselect/promql/rollup_result_cache.go:156	loaded rollupResult cache from "/usr/data/victoria-metrics/cache/rollupResult" in 0.001 seconds; entriesCount: 0, sizeBytes: 0
2024-09-03T16:33:42.207Z	info	VictoriaMetrics/app/victoria-metrics/main.go:84	started VictoriaMetrics in 0.020 seconds
2024-09-03T16:33:42.207Z	info	VictoriaMetrics/lib/httpserver/httpserver.go:121	starting server at http://127.0.0.1:8428/
2024-09-03T16:33:42.207Z	info	VictoriaMetrics/lib/httpserver/httpserver.go:122	pprof handlers are exposed at http://127.0.0.1:8428/debug/pprof/
2024-09-03T16:33:42.208Z	info	VictoriaMetrics/app/victoria-metrics/self_scraper.go:46	started self-scraping `/metrics` page with interval 10.000 seconds
2024-09-03T16:33:52.293Z	info	VictoriaMetrics/lib/storage/partition.go:202	creating a partition "2024_09" with smallPartsPath="/usr/data/victoria-metrics/data/small/2024_09", bigPartsPath="/usr/data/victoria-metrics/data/big/2024_09"
2024-09-03T16:33:52.295Z	info	VictoriaMetrics/lib/storage/partition.go:211	partition "2024_09" has been created
2如下,替换<victoriametrics-addr> 为VictoriaMetrics主机名称或者IP地址,形如http://192.168.55.88.132:8428,然后使用PromQL 或MetricsQL用创建的数据源创建图表
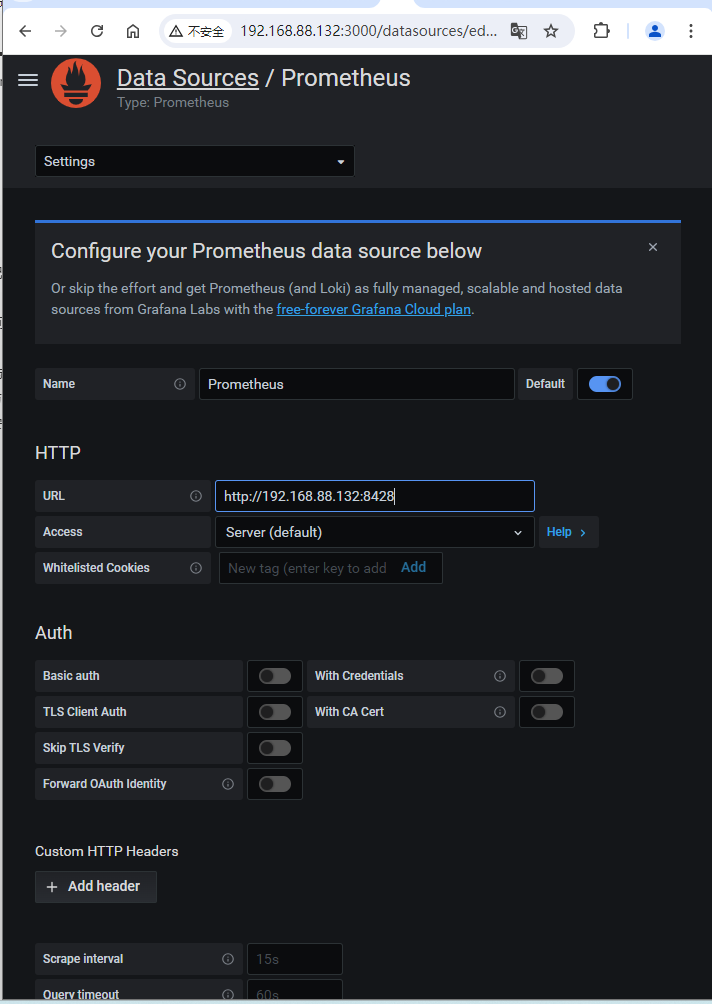
Access模式简介
访问模式控制如何处理对数据源的请求。如果没有其他说明,Server(default)应该是首选方式。
Server访问模式(默认)Cross-Origin Resource Sharing (CORS) 要求。如果选择该访问模式,则要求URL可被grafana后端/服务器访问。Browser 访问模式参考链接:https://docs.victoriametrics.com/#grafana-setup
# /usr/local/bin/victoria-metrics-prod -storageDataPath=/usr/data/victoria-metrics -retentionPeriod=30d -selfScrapeInterval=10s
2024-09-03T16:33:42.187Z	info	VictoriaMetrics/lib/logger/flag.Go:12	build version: victoria-metrics-20240828-135248-tags-v1.103.0-0-g5aeb759df9
2024-09-03T16:33:42.187Z	info	VictoriaMetrics/lib/logger/flag.go:13	command-line flags
2024-09-03T16:33:42.187Z	info	VictoriaMetrics/lib/logger/flag.go:20	  -retentionPeriod="30d"
2024-09-03T16:33:42.187Z	info	VictoriaMetrics/lib/logger/flag.go:20	  -selfScrapeInterval="10s"
2024-09-03T16:33:42.187Z	info	VictoriaMetrics/lib/logger/flag.go:20	  -storageDataPath="/usr/data/victoria-metrics"
2024-09-03T16:33:42.187Z	info	VictoriaMetrics/app/victoria-metrics/main.go:73	starting VictoriaMetrics at "[:8428]"...
2024-09-03T16:33:42.187Z	info	VictoriaMetrics/app/vmstorage/main.go:107	opening storage at "/usr/data/victoria-metrics" with -retentionPeriod=30d
2024-09-03T16:33:42.189Z	info	VictoriaMetrics/lib/memory/memory.go:42	limiting caches to 611758080 bytes, leaving 407838720 bytes to the OS according to -memory.allowedPercent=60
2024-09-03T16:33:42.205Z	info	VictoriaMetrics/app/vmstorage/main.go:121	successfully opened storage "/usr/data/victoria-metrics" in 0.018 seconds; partsCount: 0; blocksCount: 0; rowsCount: 0; sizeBytes: 0
2024-09-03T16:33:42.205Z	info	VictoriaMetrics/app/vmselect/promql/rollup_result_cache.go:127	loading rollupResult cache from "/usr/data/victoria-metrics/cache/rollupResult"...
2024-09-03T16:33:42.207Z	info	VictoriaMetrics/app/vmselect/promql/rollup_result_cache.go:156	loaded rollupResult cache from "/usr/data/victoria-metrics/cache/rollupResult" in 0.001 seconds; entriesCount: 0, sizeBytes: 0
2024-09-03T16:33:42.207Z	info	VictoriaMetrics/app/victoria-metrics/main.go:84	started VictoriaMetrics in 0.020 seconds
2024-09-03T16:33:42.207Z	info	VictoriaMetrics/lib/httpserver/httpserver.go:121	starting server at http://127.0.0.1:8428/
2024-09-03T16:33:42.207Z	info	VictoriaMetrics/lib/httpserver/httpserver.go:122	pprof handlers are exposed at http://127.0.0.1:8428/debug/pprof/
2024-09-03T16:33:42.208Z	info	VictoriaMetrics/app/victoria-metrics/self_scraper.go:46	started self-scraping `/metrics` page with interval 10.000 seconds
2024-09-03T16:33:52.293Z	info	VictoriaMetrics/lib/storage/partition.go:202	creating a partition "2024_09" with smallPartsPath="/usr/data/victoria-metrics/data/small/2024_09", bigPartsPath="/usr/data/victoria-metrics/data/big/2024_09"
2024-09-03T16:33:52.295Z	info	VictoriaMetrics/lib/storage/partition.go:211	partition "2024_09" has been created
3# /usr/local/bin/victoria-metrics-prod -storageDataPath=/usr/data/victoria-metrics -retentionPeriod=30d -selfScrapeInterval=10s
2024-09-03T16:33:42.187Z info VictoriaMetrics/lib/logger/flag.Go:12 build version: victoria-metrics-20240828-135248-tags-v1.103.0-0-g5aeb759df9
2024-09-03T16:33:42.187Z info VictoriaMetrics/lib/logger/flag.go:13 command-line flags
2024-09-03T16:33:42.187Z info VictoriaMetrics/lib/logger/flag.go:20 -retentionPeriod="30d"
2024-09-03T16:33:42.187Z info VictoriaMetrics/lib/logger/flag.go:20 -selfScrapeInterval="10s"
2024-09-03T16:33:42.187Z info VictoriaMetrics/lib/logger/flag.go:20 -storageDataPath="/usr/data/victoria-metrics"
2024-09-03T16:33:42.187Z info VictoriaMetrics/app/victoria-metrics/main.go:73 starting VictoriaMetrics at "[:8428]"...
2024-09-03T16:33:42.187Z info VictoriaMetrics/app/vmstorage/main.go:107 opening storage at "/usr/data/victoria-metrics" with -retentionPeriod=30d
2024-09-03T16:33:42.189Z info VictoriaMetrics/lib/memory/memory.go:42 limiting caches to 611758080 bytes, leaving 407838720 bytes to the OS according to -memory.allowedPercent=60
2024-09-03T16:33:42.205Z info VictoriaMetrics/app/vmstorage/main.go:121 successfully opened storage "/usr/data/victoria-metrics" in 0.018 seconds; partsCount: 0; blocksCount: 0; rowsCount: 0; sizeBytes: 0
2024-09-03T16:33:42.205Z info VictoriaMetrics/app/vmselect/promql/rollup_result_cache.go:127 loading rollupResult cache from "/usr/data/victoria-metrics/cache/rollupResult"...
2024-09-03T16:33:42.207Z info VictoriaMetrics/app/vmselect/promql/rollup_result_cache.go:156 loaded rollupResult cache from "/usr/data/victoria-metrics/cache/rollupResult" in 0.001 seconds; entriesCount: 0, sizeBytes: 0
2024-09-03T16:33:42.207Z info VictoriaMetrics/app/victoria-metrics/main.go:84 started VictoriaMetrics in 0.020 seconds
2024-09-03T16:33:42.207Z info VictoriaMetrics/lib/httpserver/httpserver.go:121 starting server at http://127.0.0.1:8428/
2024-09-03T16:33:42.207Z info VictoriaMetrics/lib/httpserver/httpserver.go:122 pprof handlers are exposed at http://127.0.0.1:8428/debug/pprof/
2024-09-03T16:33:42.208Z info VictoriaMetrics/app/victoria-metrics/self_scraper.go:46 started self-scraping `/metrics` page with interval 10.000 seconds
2024-09-03T16:33:52.293Z info VictoriaMetrics/lib/storage/partition.go:202 creating a partition "2024_09" with smallPartsPath="/usr/data/victoria-metrics/data/small/2024_09", bigPartsPath="/usr/data/victoria-metrics/data/big/2024_09"
2024-09-03T16:33:52.295Z info VictoriaMetrics/lib/storage/partition.go:211 partition "2024_09" has been created
4# /usr/local/bin/victoria-metrics-prod -storageDataPath=/usr/data/victoria-metrics -retentionPeriod=30d -selfScrapeInterval=10s
2024-09-03T16:33:42.187Z info VictoriaMetrics/lib/logger/flag.Go:12 build version: victoria-metrics-20240828-135248-tags-v1.103.0-0-g5aeb759df9
2024-09-03T16:33:42.187Z info VictoriaMetrics/lib/logger/flag.go:13 command-line flags
2024-09-03T16:33:42.187Z info VictoriaMetrics/lib/logger/flag.go:20 -retentionPeriod="30d"
2024-09-03T16:33:42.187Z info VictoriaMetrics/lib/logger/flag.go:20 -selfScrapeInterval="10s"
2024-09-03T16:33:42.187Z info VictoriaMetrics/lib/logger/flag.go:20 -storageDataPath="/usr/data/victoria-metrics"
2024-09-03T16:33:42.187Z info VictoriaMetrics/app/victoria-metrics/main.go:73 starting VictoriaMetrics at "[:8428]"...
2024-09-03T16:33:42.187Z info VictoriaMetrics/app/vmstorage/main.go:107 opening storage at "/usr/data/victoria-metrics" with -retentionPeriod=30d
2024-09-03T16:33:42.189Z info VictoriaMetrics/lib/memory/memory.go:42 limiting caches to 611758080 bytes, leaving 407838720 bytes to the OS according to -memory.allowedPercent=60
2024-09-03T16:33:42.205Z info VictoriaMetrics/app/vmstorage/main.go:121 successfully opened storage "/usr/data/victoria-metrics" in 0.018 seconds; partsCount: 0; blocksCount: 0; rowsCount: 0; sizeBytes: 0
2024-09-03T16:33:42.205Z info VictoriaMetrics/app/vmselect/promql/rollup_result_cache.go:127 loading rollupResult cache from "/usr/data/victoria-metrics/cache/rollupResult"...
2024-09-03T16:33:42.207Z info VictoriaMetrics/app/vmselect/promql/rollup_result_cache.go:156 loaded rollupResult cache from "/usr/data/victoria-metrics/cache/rollupResult" in 0.001 seconds; entriesCount: 0, sizeBytes: 0
2024-09-03T16:33:42.207Z info VictoriaMetrics/app/victoria-metrics/main.go:84 started VictoriaMetrics in 0.020 seconds
2024-09-03T16:33:42.207Z info VictoriaMetrics/lib/httpserver/httpserver.go:121 starting server at http://127.0.0.1:8428/
2024-09-03T16:33:42.207Z info VictoriaMetrics/lib/httpserver/httpserver.go:122 pprof handlers are exposed at http://127.0.0.1:8428/debug/pprof/
2024-09-03T16:33:42.208Z info VictoriaMetrics/app/victoria-metrics/self_scraper.go:46 started self-scraping `/metrics` page with interval 10.000 seconds
2024-09-03T16:33:52.293Z info VictoriaMetrics/lib/storage/partition.go:202 creating a partition "2024_09" with smallPartsPath="/usr/data/victoria-metrics/data/small/2024_09", bigPartsPath="/usr/data/victoria-metrics/data/big/2024_09"
2024-09-03T16:33:52.295Z info VictoriaMetrics/lib/storage/partition.go:211 partition "2024_09" has been created
5先手动停止上述前台运行的pushgateway,然后执行以下命令
# /usr/local/bin/victoria-metrics-prod -storageDataPath=/usr/data/victoria-metrics -retentionPeriod=30d -selfScrapeInterval=10s
2024-09-03T16:33:42.187Z	info	VictoriaMetrics/lib/logger/flag.Go:12	build version: victoria-metrics-20240828-135248-tags-v1.103.0-0-g5aeb759df9
2024-09-03T16:33:42.187Z	info	VictoriaMetrics/lib/logger/flag.go:13	command-line flags
2024-09-03T16:33:42.187Z	info	VictoriaMetrics/lib/logger/flag.go:20	  -retentionPeriod="30d"
2024-09-03T16:33:42.187Z	info	VictoriaMetrics/lib/logger/flag.go:20	  -selfScrapeInterval="10s"
2024-09-03T16:33:42.187Z	info	VictoriaMetrics/lib/logger/flag.go:20	  -storageDataPath="/usr/data/victoria-metrics"
2024-09-03T16:33:42.187Z	info	VictoriaMetrics/app/victoria-metrics/main.go:73	starting VictoriaMetrics at "[:8428]"...
2024-09-03T16:33:42.187Z	info	VictoriaMetrics/app/vmstorage/main.go:107	opening storage at "/usr/data/victoria-metrics" with -retentionPeriod=30d
2024-09-03T16:33:42.189Z	info	VictoriaMetrics/lib/memory/memory.go:42	limiting caches to 611758080 bytes, leaving 407838720 bytes to the OS according to -memory.allowedPercent=60
2024-09-03T16:33:42.205Z	info	VictoriaMetrics/app/vmstorage/main.go:121	successfully opened storage "/usr/data/victoria-metrics" in 0.018 seconds; partsCount: 0; blocksCount: 0; rowsCount: 0; sizeBytes: 0
2024-09-03T16:33:42.205Z	info	VictoriaMetrics/app/vmselect/promql/rollup_result_cache.go:127	loading rollupResult cache from "/usr/data/victoria-metrics/cache/rollupResult"...
2024-09-03T16:33:42.207Z	info	VictoriaMetrics/app/vmselect/promql/rollup_result_cache.go:156	loaded rollupResult cache from "/usr/data/victoria-metrics/cache/rollupResult" in 0.001 seconds; entriesCount: 0, sizeBytes: 0
2024-09-03T16:33:42.207Z	info	VictoriaMetrics/app/victoria-metrics/main.go:84	started VictoriaMetrics in 0.020 seconds
2024-09-03T16:33:42.207Z	info	VictoriaMetrics/lib/httpserver/httpserver.go:121	starting server at http://127.0.0.1:8428/
2024-09-03T16:33:42.207Z	info	VictoriaMetrics/lib/httpserver/httpserver.go:122	pprof handlers are exposed at http://127.0.0.1:8428/debug/pprof/
2024-09-03T16:33:42.208Z	info	VictoriaMetrics/app/victoria-metrics/self_scraper.go:46	started self-scraping `/metrics` page with interval 10.000 seconds
2024-09-03T16:33:52.293Z	info	VictoriaMetrics/lib/storage/partition.go:202	creating a partition "2024_09" with smallPartsPath="/usr/data/victoria-metrics/data/small/2024_09", bigPartsPath="/usr/data/victoria-metrics/data/big/2024_09"
2024-09-03T16:33:52.295Z	info	VictoriaMetrics/lib/storage/partition.go:211	partition "2024_09" has been created
6注意:只需在需要被监控的机器上安装(本例中为一台Redis服务器,IP:192.168.88.131)
# /usr/local/bin/victoria-metrics-prod -storageDataPath=/usr/data/victoria-metrics -retentionPeriod=30d -selfScrapeInterval=10s
2024-09-03T16:33:42.187Z	info	VictoriaMetrics/lib/logger/flag.Go:12	build version: victoria-metrics-20240828-135248-tags-v1.103.0-0-g5aeb759df9
2024-09-03T16:33:42.187Z	info	VictoriaMetrics/lib/logger/flag.go:13	command-line flags
2024-09-03T16:33:42.187Z	info	VictoriaMetrics/lib/logger/flag.go:20	  -retentionPeriod="30d"
2024-09-03T16:33:42.187Z	info	VictoriaMetrics/lib/logger/flag.go:20	  -selfScrapeInterval="10s"
2024-09-03T16:33:42.187Z	info	VictoriaMetrics/lib/logger/flag.go:20	  -storageDataPath="/usr/data/victoria-metrics"
2024-09-03T16:33:42.187Z	info	VictoriaMetrics/app/victoria-metrics/main.go:73	starting VictoriaMetrics at "[:8428]"...
2024-09-03T16:33:42.187Z	info	VictoriaMetrics/app/vmstorage/main.go:107	opening storage at "/usr/data/victoria-metrics" with -retentionPeriod=30d
2024-09-03T16:33:42.189Z	info	VictoriaMetrics/lib/memory/memory.go:42	limiting caches to 611758080 bytes, leaving 407838720 bytes to the OS according to -memory.allowedPercent=60
2024-09-03T16:33:42.205Z	info	VictoriaMetrics/app/vmstorage/main.go:121	successfully opened storage "/usr/data/victoria-metrics" in 0.018 seconds; partsCount: 0; blocksCount: 0; rowsCount: 0; sizeBytes: 0
2024-09-03T16:33:42.205Z	info	VictoriaMetrics/app/vmselect/promql/rollup_result_cache.go:127	loading rollupResult cache from "/usr/data/victoria-metrics/cache/rollupResult"...
2024-09-03T16:33:42.207Z	info	VictoriaMetrics/app/vmselect/promql/rollup_result_cache.go:156	loaded rollupResult cache from "/usr/data/victoria-metrics/cache/rollupResult" in 0.001 seconds; entriesCount: 0, sizeBytes: 0
2024-09-03T16:33:42.207Z	info	VictoriaMetrics/app/victoria-metrics/main.go:84	started VictoriaMetrics in 0.020 seconds
2024-09-03T16:33:42.207Z	info	VictoriaMetrics/lib/httpserver/httpserver.go:121	starting server at http://127.0.0.1:8428/
2024-09-03T16:33:42.207Z	info	VictoriaMetrics/lib/httpserver/httpserver.go:122	pprof handlers are exposed at http://127.0.0.1:8428/debug/pprof/
2024-09-03T16:33:42.208Z	info	VictoriaMetrics/app/victoria-metrics/self_scraper.go:46	started self-scraping `/metrics` page with interval 10.000 seconds
2024-09-03T16:33:52.293Z	info	VictoriaMetrics/lib/storage/partition.go:202	creating a partition "2024_09" with smallPartsPath="/usr/data/victoria-metrics/data/small/2024_09", bigPartsPath="/usr/data/victoria-metrics/data/big/2024_09"
2024-09-03T16:33:52.295Z	info	VictoriaMetrics/lib/storage/partition.go:211	partition "2024_09" has been created
7
通过输出可知,Node Exporter已在运行,并且在端口9100暴露指标
通过请求/metrics端点来确认指标是否已成功暴露:
# /usr/local/bin/victoria-metrics-prod -storageDataPath=/usr/data/victoria-metrics -retentionPeriod=30d -selfScrapeInterval=10s
2024-09-03T16:33:42.187Z	info	VictoriaMetrics/lib/logger/flag.Go:12	build version: victoria-metrics-20240828-135248-tags-v1.103.0-0-g5aeb759df9
2024-09-03T16:33:42.187Z	info	VictoriaMetrics/lib/logger/flag.go:13	command-line flags
2024-09-03T16:33:42.187Z	info	VictoriaMetrics/lib/logger/flag.go:20	  -retentionPeriod="30d"
2024-09-03T16:33:42.187Z	info	VictoriaMetrics/lib/logger/flag.go:20	  -selfScrapeInterval="10s"
2024-09-03T16:33:42.187Z	info	VictoriaMetrics/lib/logger/flag.go:20	  -storageDataPath="/usr/data/victoria-metrics"
2024-09-03T16:33:42.187Z	info	VictoriaMetrics/app/victoria-metrics/main.go:73	starting VictoriaMetrics at "[:8428]"...
2024-09-03T16:33:42.187Z	info	VictoriaMetrics/app/vmstorage/main.go:107	opening storage at "/usr/data/victoria-metrics" with -retentionPeriod=30d
2024-09-03T16:33:42.189Z	info	VictoriaMetrics/lib/memory/memory.go:42	limiting caches to 611758080 bytes, leaving 407838720 bytes to the OS according to -memory.allowedPercent=60
2024-09-03T16:33:42.205Z	info	VictoriaMetrics/app/vmstorage/main.go:121	successfully opened storage "/usr/data/victoria-metrics" in 0.018 seconds; partsCount: 0; blocksCount: 0; rowsCount: 0; sizeBytes: 0
2024-09-03T16:33:42.205Z	info	VictoriaMetrics/app/vmselect/promql/rollup_result_cache.go:127	loading rollupResult cache from "/usr/data/victoria-metrics/cache/rollupResult"...
2024-09-03T16:33:42.207Z	info	VictoriaMetrics/app/vmselect/promql/rollup_result_cache.go:156	loaded rollupResult cache from "/usr/data/victoria-metrics/cache/rollupResult" in 0.001 seconds; entriesCount: 0, sizeBytes: 0
2024-09-03T16:33:42.207Z	info	VictoriaMetrics/app/victoria-metrics/main.go:84	started VictoriaMetrics in 0.020 seconds
2024-09-03T16:33:42.207Z	info	VictoriaMetrics/lib/httpserver/httpserver.go:121	starting server at http://127.0.0.1:8428/
2024-09-03T16:33:42.207Z	info	VictoriaMetrics/lib/httpserver/httpserver.go:122	pprof handlers are exposed at http://127.0.0.1:8428/debug/pprof/
2024-09-03T16:33:42.208Z	info	VictoriaMetrics/app/victoria-metrics/self_scraper.go:46	started self-scraping `/metrics` page with interval 10.000 seconds
2024-09-03T16:33:52.293Z	info	VictoriaMetrics/lib/storage/partition.go:202	creating a partition "2024_09" with smallPartsPath="/usr/data/victoria-metrics/data/small/2024_09", bigPartsPath="/usr/data/victoria-metrics/data/big/2024_09"
2024-09-03T16:33:52.295Z	info	VictoriaMetrics/lib/storage/partition.go:211	partition "2024_09" has been created
8
看到类似下输出则表明暴露成功。
# /usr/local/bin/victoria-metrics-prod -storageDataPath=/usr/data/victoria-metrics -retentionPeriod=30d -selfScrapeInterval=10s
2024-09-03T16:33:42.187Z	info	VictoriaMetrics/lib/logger/flag.Go:12	build version: victoria-metrics-20240828-135248-tags-v1.103.0-0-g5aeb759df9
2024-09-03T16:33:42.187Z	info	VictoriaMetrics/lib/logger/flag.go:13	command-line flags
2024-09-03T16:33:42.187Z	info	VictoriaMetrics/lib/logger/flag.go:20	  -retentionPeriod="30d"
2024-09-03T16:33:42.187Z	info	VictoriaMetrics/lib/logger/flag.go:20	  -selfScrapeInterval="10s"
2024-09-03T16:33:42.187Z	info	VictoriaMetrics/lib/logger/flag.go:20	  -storageDataPath="/usr/data/victoria-metrics"
2024-09-03T16:33:42.187Z	info	VictoriaMetrics/app/victoria-metrics/main.go:73	starting VictoriaMetrics at "[:8428]"...
2024-09-03T16:33:42.187Z	info	VictoriaMetrics/app/vmstorage/main.go:107	opening storage at "/usr/data/victoria-metrics" with -retentionPeriod=30d
2024-09-03T16:33:42.189Z	info	VictoriaMetrics/lib/memory/memory.go:42	limiting caches to 611758080 bytes, leaving 407838720 bytes to the OS according to -memory.allowedPercent=60
2024-09-03T16:33:42.205Z	info	VictoriaMetrics/app/vmstorage/main.go:121	successfully opened storage "/usr/data/victoria-metrics" in 0.018 seconds; partsCount: 0; blocksCount: 0; rowsCount: 0; sizeBytes: 0
2024-09-03T16:33:42.205Z	info	VictoriaMetrics/app/vmselect/promql/rollup_result_cache.go:127	loading rollupResult cache from "/usr/data/victoria-metrics/cache/rollupResult"...
2024-09-03T16:33:42.207Z	info	VictoriaMetrics/app/vmselect/promql/rollup_result_cache.go:156	loaded rollupResult cache from "/usr/data/victoria-metrics/cache/rollupResult" in 0.001 seconds; entriesCount: 0, sizeBytes: 0
2024-09-03T16:33:42.207Z	info	VictoriaMetrics/app/victoria-metrics/main.go:84	started VictoriaMetrics in 0.020 seconds
2024-09-03T16:33:42.207Z	info	VictoriaMetrics/lib/httpserver/httpserver.go:121	starting server at http://127.0.0.1:8428/
2024-09-03T16:33:42.207Z	info	VictoriaMetrics/lib/httpserver/httpserver.go:122	pprof handlers are exposed at http://127.0.0.1:8428/debug/pprof/
2024-09-03T16:33:42.208Z	info	VictoriaMetrics/app/victoria-metrics/self_scraper.go:46	started self-scraping `/metrics` page with interval 10.000 seconds
2024-09-03T16:33:52.293Z	info	VictoriaMetrics/lib/storage/partition.go:202	creating a partition "2024_09" with smallPartsPath="/usr/data/victoria-metrics/data/small/2024_09", bigPartsPath="/usr/data/victoria-metrics/data/big/2024_09"
2024-09-03T16:33:52.295Z	info	VictoriaMetrics/lib/storage/partition.go:211	partition "2024_09" has been created
9
Node Exporter现在暴露了Prometheus可以抓取的指标,包括输出中更深层级的各种系统指标(以node_为前缀)。要查看这些指标可以执行以下命令:
# systemctl daemon-reload && sudo systemctl enable --now victoriametrics.service
# 查看服务是否启动成功
# systemctl status victoriametrics.service
0# systemctl daemon-reload && sudo systemctl enable --now victoriametrics.service
# 查看服务是否启动成功
# systemctl status victoriametrics.service
1# systemctl daemon-reload && sudo systemctl enable --now victoriametrics.service
# 查看服务是否启动成功
# systemctl status victoriametrics.service
2官方安装指引:
# systemctl daemon-reload && sudo systemctl enable --now victoriametrics.service
# 查看服务是否启动成功
# systemctl status victoriametrics.service
3
说明:该安装方式无法安装成功
可行安装方式:
# systemctl daemon-reload && sudo systemctl enable --now victoriametrics.service
# 查看服务是否启动成功
# systemctl status victoriametrics.service
4服务器节点1(192.168.88.133):
# systemctl daemon-reload && sudo systemctl enable --now victoriametrics.service
# 查看服务是否启动成功
# systemctl status victoriametrics.service
5服务器节点2(192.168.88.134):
# systemctl daemon-reload && sudo systemctl enable --now victoriametrics.service
# 查看服务是否启动成功
# systemctl status victoriametrics.service
6说明:启动后加入集群192.168.88.134:8301
浏览器访问验证
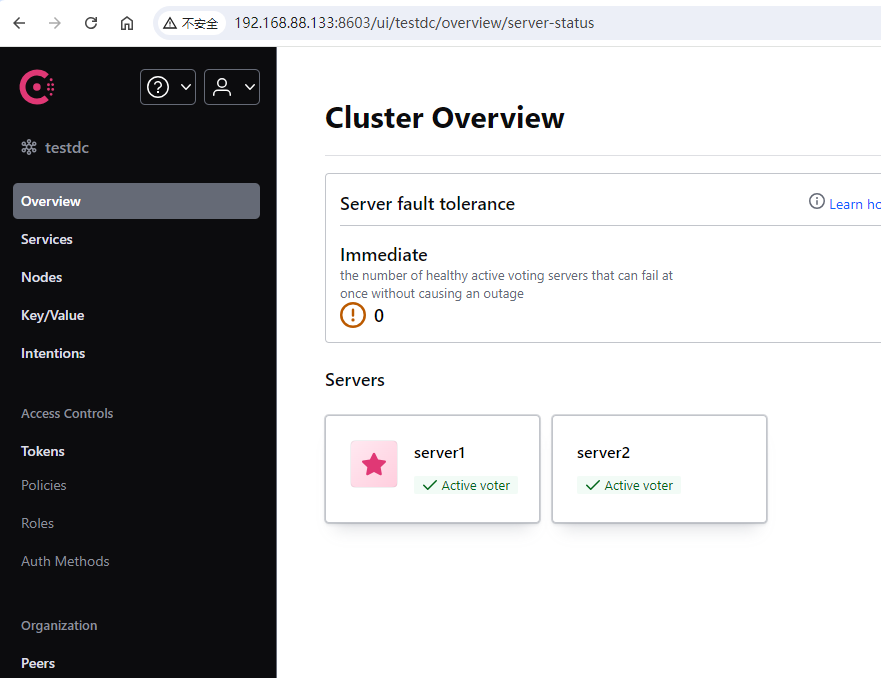
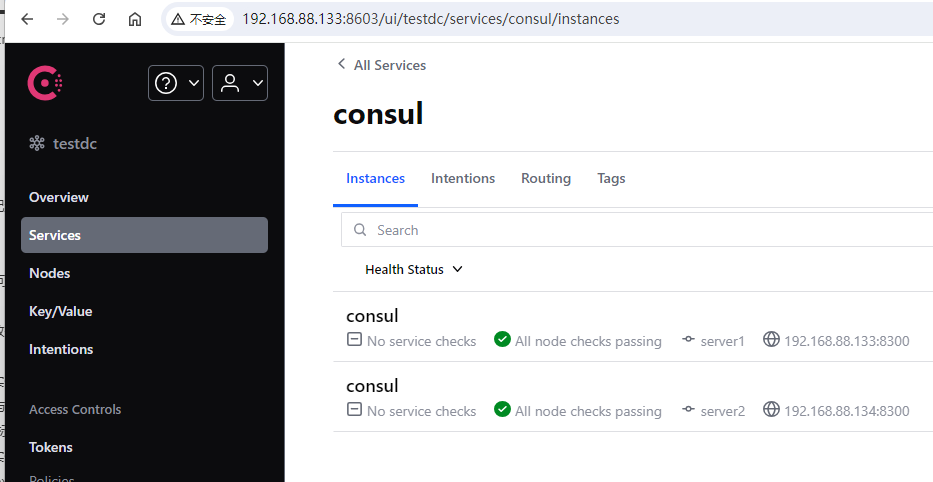
服务器节点1(192.168.88.133):
# systemctl daemon-reload && sudo systemctl enable --now victoriametrics.service
# 查看服务是否启动成功
# systemctl status victoriametrics.service
7
# systemctl daemon-reload && sudo systemctl enable --now victoriametrics.service
# 查看服务是否启动成功
# systemctl status victoriametrics.service
8服务器节点2(192.168.88.134):
# systemctl daemon-reload && sudo systemctl enable --now victoriametrics.service
# 查看服务是否启动成功
# systemctl status victoriametrics.service
7
# firewall-cmd --permanent --zone=public --add-port=8248/tcp
success
# firewall-cmd --reload
success
0先手动停止上述前台运行的consul,然后分别在两台机器上执行以下命令
# firewall-cmd --permanent --zone=public --add-port=8248/tcp
success
# firewall-cmd --reload
success
1
参考链接:
https://developer.hashicorp.com/consul/install
https://developer.hashicorp.com/consul/docs/agent
# firewall-cmd --permanent --zone=public --add-port=8248/tcp
success
# firewall-cmd --reload
success
2为了访问采集Consul集群相关服务的指标,需要正确配置本地运行的Prometheus实例。
修改prometheus配置文件
# firewall-cmd --permanent --zone=public --add-port=8248/tcp
success
# firewall-cmd --reload
success
3
重启Prometheus
# firewall-cmd --permanent --zone=public --add-port=8248/tcp
success
# firewall-cmd --reload
success
4
参考链接:
https://prometheus.io/blog/2015/06/01/advanced-service-discovery/#discovery-with-consul
Status -> Targets
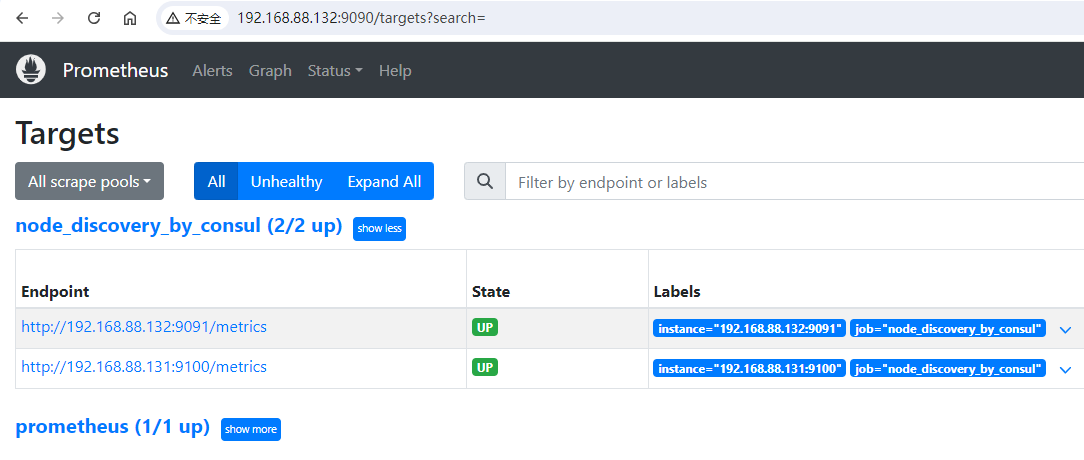
点击对应Endpoint,自动跳转并显示指标数据
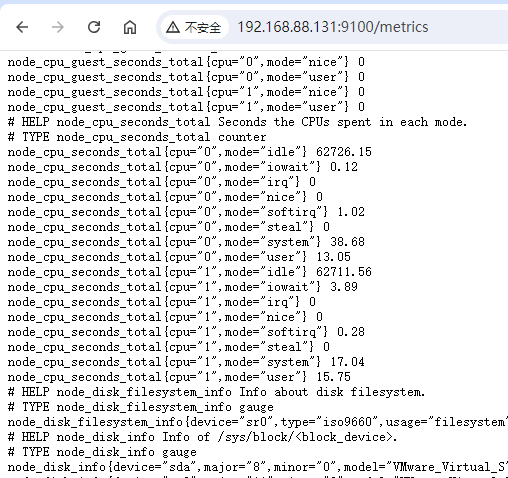
通过Prometheus Expression browser查看Node Exporter 指标
特定于Node Exporter的指标前缀为Node_,包括Node_cpu_seconds_total和Node_Exporter_build_info等指标。
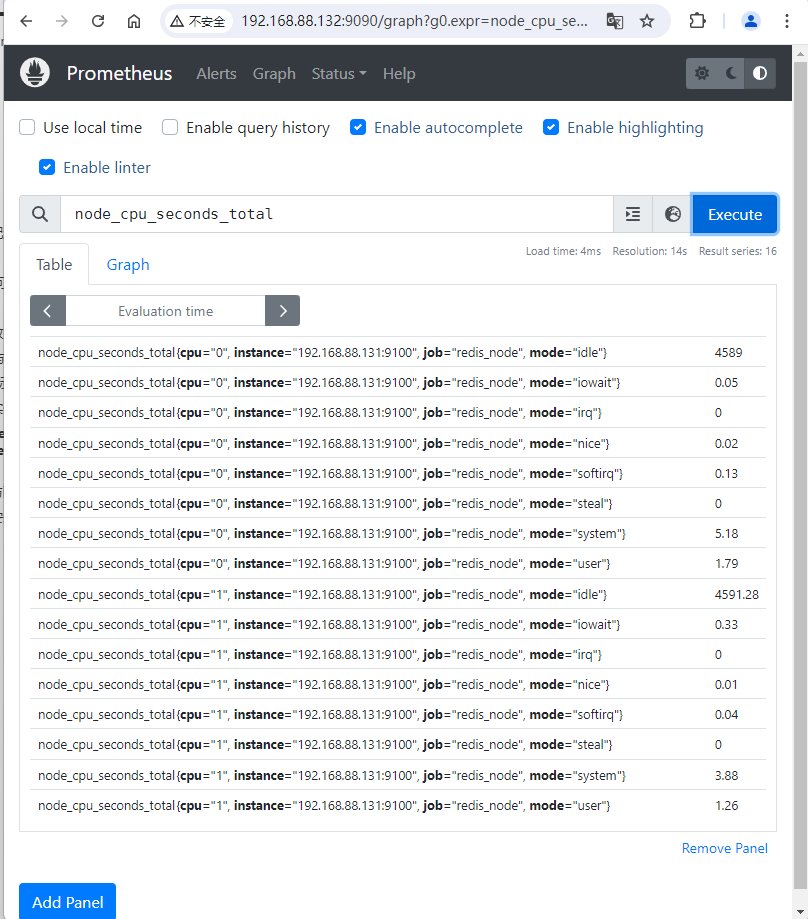
点击以下链接查看一些示例指标
| Metric | Meaning |
|---|---|
rate(node_cpu_seconds_total{mode="system"}[1m]) |
最近一分钟,每秒在系统模式下消耗的CPU时间平均值(以秒为单位) |
node_filesystem_avail_bytes |
非root用户可用的文件系统空间(以字节为单位) |
rate(node_network_receive_bytes_total[1m]) |
最近一分钟,每秒接收的平均网络流量(以字节为单位) |
普罗米修斯配置
# firewall-cmd --permanent --zone=public --add-port=8248/tcp
success
# firewall-cmd --reload
success
5